Posts

Derivative Data - CLIENT (RETAIL) FII DII AND PRO - Nifty and Stocks - Daily Analysis - 16th December
Image
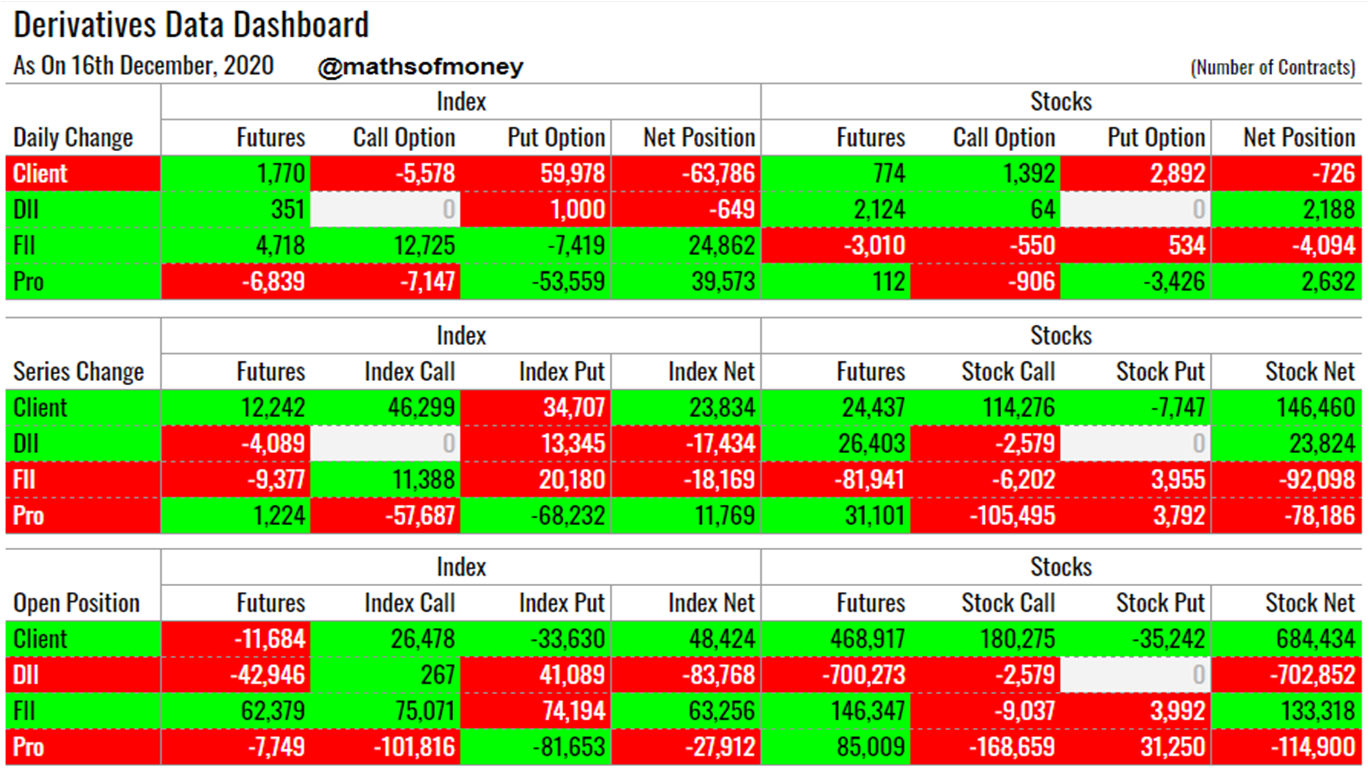
Derivative Data Dashboard - 16th December In depth analysis of Derivative Data including open positions, daily trades (daily change) and series change in derivatives of Index (covering Both Nifty and Bank Nifty) and Stocks with breakup of trades in futures, call options and put options for each category of participants. Technical Trader Derivatives Data Yesterday's Derivative Data Analysis - For Comparison 15th December - Dashboard Here are key highlights for today: Daily Change in Index and Stocks Derivatives (Net trades executed today by each participant - Client, FII, DII and Pro): Today's major shift in positions is only in index contracts while positions in stocks have been mostly muted. This is quite understandable considering its day before weekly expiry.   Clients (Retail Investors) are net sellers of 64k index contracts which was primarily by way of buying in Put Options. This is unwinding of huge short positions in Index Put Options retail was carrying till yesterda...
Derivative Data - CLIENT (RETAIL) FII DII AND PRO - Nifty and Stocks - Daily Analysis - 15th December

Image
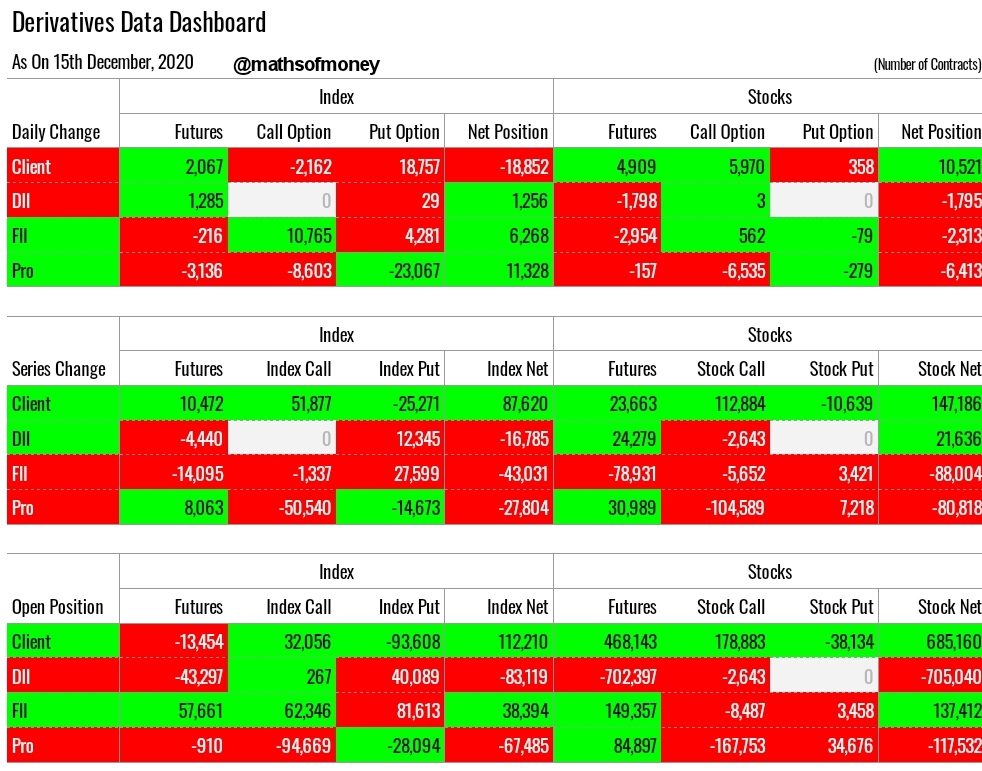
Derivative Data Dashboard - 15th December Participant wise Derivative Data including open positions, daily trades (daily change) and series change in derivatives of Index (covering Both Nifty and Bank Nifty) and Stocks with breakup of trades in futures, call options and put options.  Here are key highlights: Daily Change in Index and Stocks Derivatives (Net trades executed today by each participant - Client, FII, DII and Pro): Daily net change in index and stocks are contradictory today with Retail being net seller of Index Contracts whereas net buyer of Stock contracts.  Net index sell by Retail comprises mostly of long positions of 18,757 put contracts. This is a limited risk exposure for clients in case of significant upside and on the other hand they have hedged 15% of their net index long position with this trade for the day.  Clients (Retail) have created 10k contracts worth of net long positions in stock. This is continuation of trend we are seeing since last few d...

Derivative Data - CLIENT (RETAIL) FII DII AND PRO - Nifty and Stocks - Daily Analysis - 14th December

Image
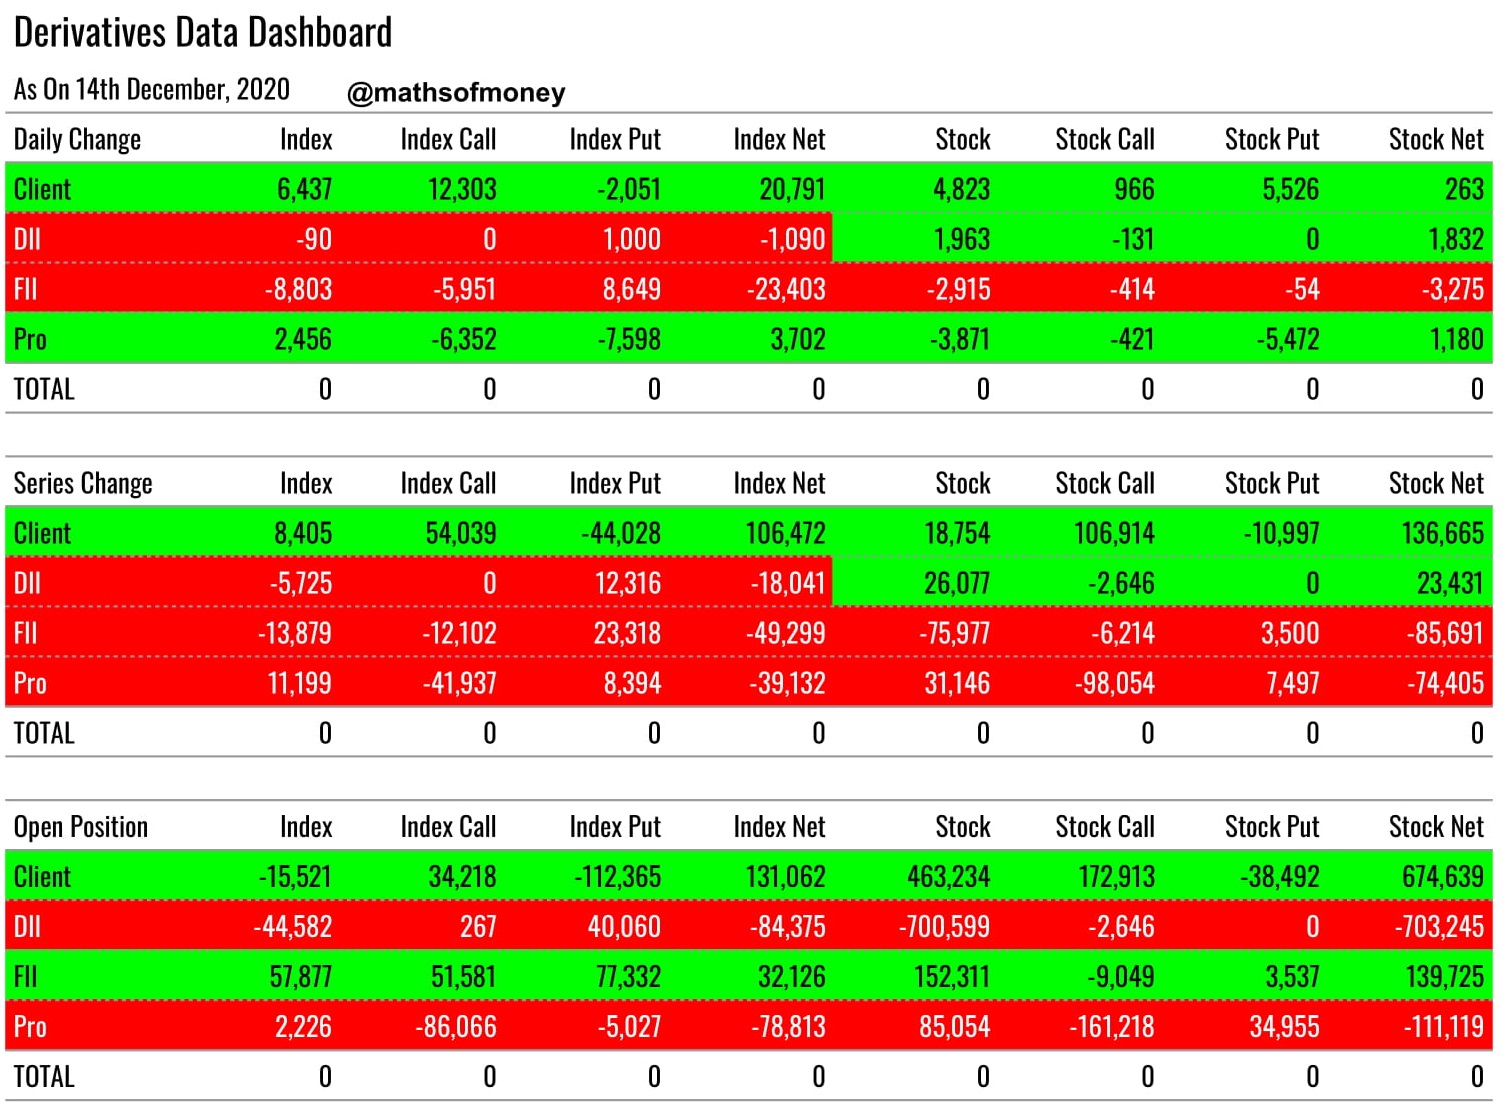
 Derivative Data Dashboard - 14th December Updated Derivatives Data covering open position, daily trades (change) and series change in derivatives of Index (covering Both Nifty and Bank Nifty) and Stocks with breakup of trades in futures, call options and put options.  Here are key highlights: Daily Change in Index and Stocks Derivatives (Net trades executed today by each participant - Client, FII, DII and Pro): Out of total of 24,000 contracts worth of net long positions in Index, Clients have bought in excess of 20,000 contracts. Again a day of significant long position in Index by Clients while all other others are either borderline buyers of significant sellers. Clients (Retailers) added 20,791 net long contracts in Index which is a net long position without any internal hedge i.e. Buying Index Futures Contracts (6,437), Buying Index Call Options (12,303) and Selling Index Put Options (2,051). Clients were sold these 12,303 contracts of  index call options by FII...

Derivative Data - CLIENT (RETAIL) FII DII AND PRO - Nifty and Stocks - Daily Analysis - 11th December

Image
 Derivative Data Dashboard - 11th December Here is daily updated analysis of Derivatives Data covering open position, daily trades (change) and series change in derivatives of Index (covering Both Nifty and Bank Nifty) and Stocks with breakup of trades in futures, call options and put options.  Here are key highlights: Daily Change in Index and Stocks Derivatives (Net trades executed today by each participant - Client, FII, DII and Pro): Clients (Retailers) added 41,103 net long contracts in Index with selling of 14,877 contracts of Puts which is maximum loss scenario in case market crashes. Clients short position in Nifty of 5,827 contracts and equivalent amount of call buying, if assumed as hedged short position in Index Futures, still that leaves clients adding balance 27,000 contracts of Index Call as net long positions.  FII, DII and Pro all three were net sellers of Index Contracts which indicates distribution as this is happening near the peak point of Nifty and ...

Weekly Targets - Key Stocks - December 7th to 11th

Image
 Here is the summary of our weekly picks for December 7th to December 11th:    Notes: SL: Intraday Stop Loss should be set as 15 minutes candle closing above / below the Stop Loss Level Active On: Watch closely the direction change in prices at these levels. <>: Make or break levels and results in trade in the direction the price moves from this levels Now let us analyse some of the recommendations for the week in detail with their weekly technical levels: 1. Reliance Here is the hourly chart of Reliance Industries with trend lines: As you can see since touching the lows of 1835 in November, Reliance has been taking support at the red trend line. On the upper side, since last week of November, Reliance has been able to cross the levels of 1985 on closing basis which is also the top side of the three Doji formation Reliance made during this period. Therefore, any upside move can be expected in Reliance only when it crosses 1985 on closing basis. Untill then, a s...

NIfty FMCG - CNXFMCG - Long Term Analysis

Image
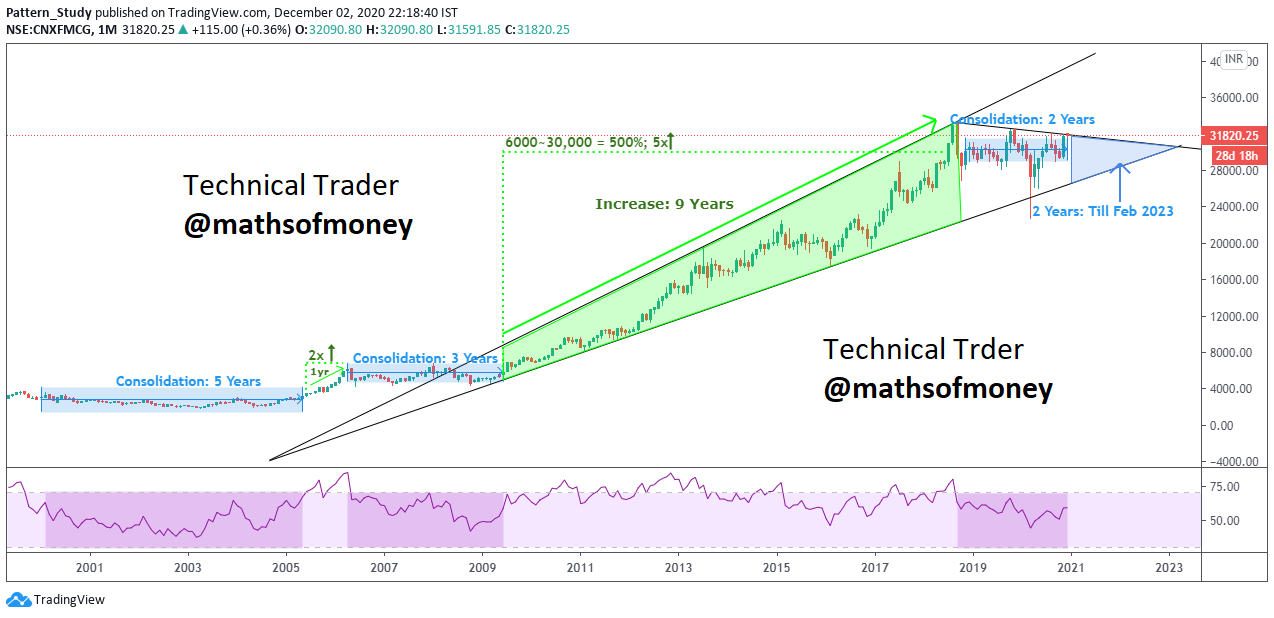
FMCG Theme Consumption is the theme which has seen multi fold rise both in terms of market and market cap over last decade in India. FMCG with increasing infrastructure and logistics has been able to tap into the Rural demand of India to experience exponential growth in market size. This has been duly reflected in price movement of Nifty FMCG (CNX FMCG - used interchangably for SEO Purposes). Nifty FMCG - Monthly Price Movement Let us begin with understanding monthly chart for CNX FMCG over last two decades to study the price action: Nifty FMCG has risen by about ten times over last two decades,  however, this increase has not been lateral,  with two consolidation periods totaling eight years, the major rise has been during last nine years since late 2009 which was primarily fueled by the two heavy weights of CNX FMCG - Hindustan Unilever and ITC (Please bear in mind that the index gets rebalanced every six months so this is more of a continuing high weight age consi...

Kotak Bank - December - More good news or Profit Booking

Image
Follow @mathsofmoney Let us look at the daily chart first: Kotak Bank was moving in an upward Wedge since April 2019 on the daily chart basis. Even though it has been able to plough back all of its covid beating, got back into the same wedge, however, now stands at the top of the wedge which is a strong resistance for Kotak Bank to cross in order to continue its upwards journey.  As is evident from last few days of November, Kotak Bank has tried to cross over the top of the wedge but couldn't close successfully above it. At the same time there was no severe selling at this level to suggest any imminent downward movement. The moot question is whether there has been consolidated at 1900 levels or there is distribution. In order to understand this lest first see the news flow which has been driving the prices for Kotak Bank.  Acquisition of Indusind Bank The push Kotak Bank prices received from the levels of 1300 in October was first from the news of acquisition of Indusind Bank ...